|
If you're like me and watching the Olympics at the moment, you probably have watched some of the speed skating events. I was watching the Women's 3000 m event the other night and curious if the split times of each lap would be interesting and or predictive of who would win. 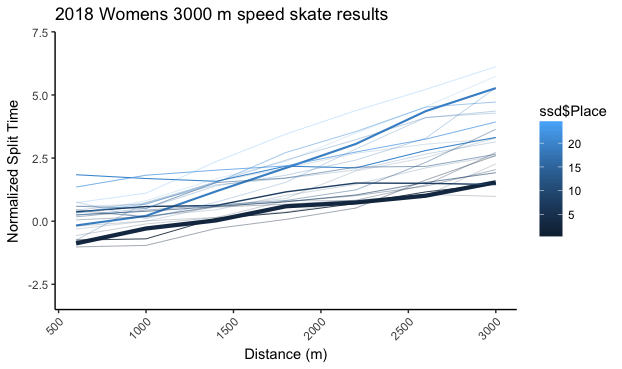 Above is a plot of all ~20 competitors in the 2018 Women's 3000 m speed skating event. They are normalized so that 0 is the average lap time for the entire competition. I removed the 0 - 600 m segment as that includes a shorter measurement unit which complicates the curve. Furthermore, the line width and color is controlled by the finishing place. If you watched the event, you probably know who won. The Dutch continue to dominate... The slope of each line segment is the pace of the skater for each lap of the race. What's interesting is that the entire field continues to slow over the course of the vent; however, some athletes do have an impressively slow loss of speed or even for a few laps acceleration (seen as segments with a negative slope). Achtereekte, who won the race, has a very early fast couple of laps and was able to to control her slowing pace (as seen by her consistent skating style throughout the event). She notably didn't have the fastest pace at the finish, but she had the fastest overall pace. 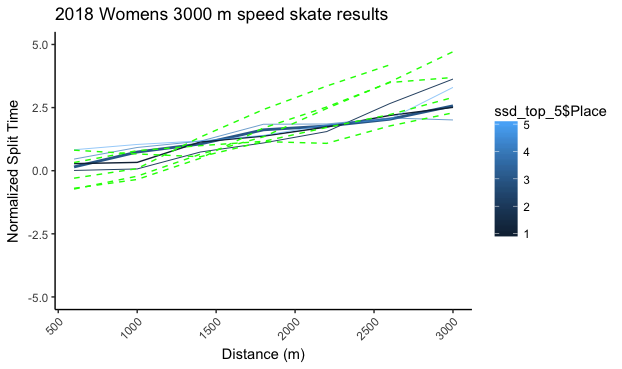 Here is a plot with the top 5 finishers and the bottom 5 finishers. Those athletes that finished in the top of the field were not necessarily the fastest at the beginning of the race as seen by the green lines below the blue ones at 500 m; however, the athletes that won the race were able to maintain a slower loss-of-speed than the bottom 5 finishers, who slowed quickly. 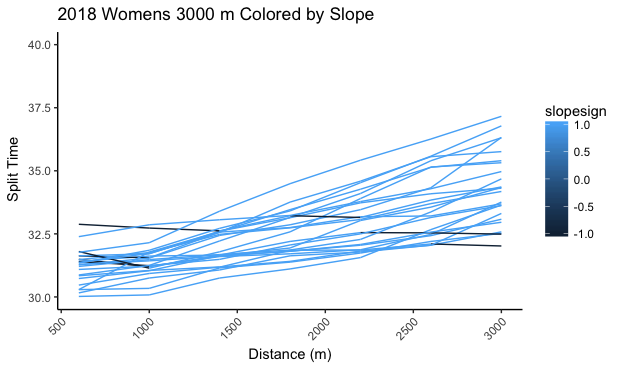 And just quickly, I put together a plot that shows the sign of the slope of each racers split time. All light blue curves are positive slope (getting slower). The dark blue curves show a split where the race accelerated for one lap, getting faster. You can see that some athlete's can accelerate for a short period of a race (one maybe two laps), but for the most part, the trend is getting slower. It's the rate of how they control getting slower, not even that initial pace (see plot above) that matters most.
Data Code (R)
0 Comments
|
