|
In a previous blog post, I examined the distribution of gender for invited speakers at the 2018 Geological Society of America Meeting. I did this by hand with the conference schedule printed out. But I wanted to go one step further and see if I could extract long-term trends in GSA participation and parse gender from this data. Unfortunately, GSA does not seem to track this in any public way, so I had to resort to webscraping the 18 webpages (going back to 2003) that contain data on GSA attendees:
Motivating question:
Two months of free time and a stack-exchange question later and I have some results. 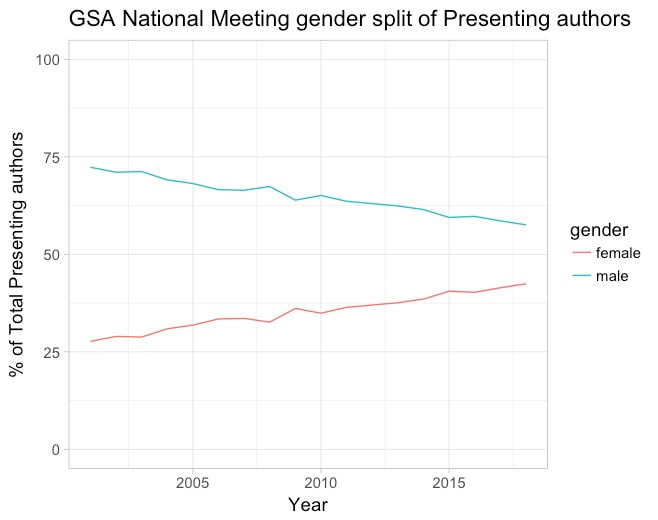 Plot showing increasing participation of female presenting authors over the last 18 years
0 Comments
|
