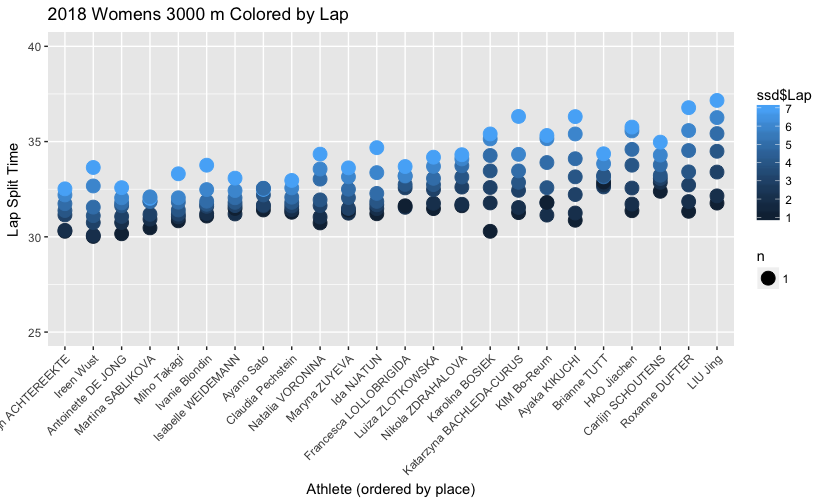
 I created a new plot after an idea coming into work today. Here are each of the 20 athletes that raced in the Women's 3000 m speed skate. Each dot represents a single full lap of the track, I cut off the partial starting lap. The athlete columns are ordered by their finishing place (first place on the left; last place on the right).
What is immediately visible is the spread in lap times. Those athletes finishing in the top 10 have an incredible knack, for the most part, to skate repeatable laps without slowing too much. Those in the bottom 10, can skate individually a fast lap here and there. Notably K. Bosiek put down a very fast first lap but couldn't maintain that speed throughout the whole race. Carlijn Achtereekte was able to race 7 laps without slowing too much, doing an even better job than Ireen Wust, which is perhaps what helped her to get that first place finish!
0 Comments
|
