|
While things here have been pretty quiet for a while, I've been slowly making progress on a detailed analysis of Obama's Judicial appointments. In his 8 years in office, Obama nominated nearly 400 justices for judgeships throughout the Federal judiciary (see nominees here). Of these nominees, only 334 were what we would deem "successful" or passed through the Senate and were confirmed. The confirmation process was not without turmoil. Specifically, I am thinking about the Republican majority that took control in 2015. After early successes in appointments, the Obama administration was hampered by Republican stonewall, the most famous example is Merrick Garland. But there are other examples (see here). I undertook an investigation of Obama's judicial nominees to examine the following details:
With the help of the Ballotpedia tabulation of Obama's nominations, and the Gender package in R, I was able to extract the gender of the nominees and other data associated with when they were nominated. See Figure 1 for the gender of the nominees: 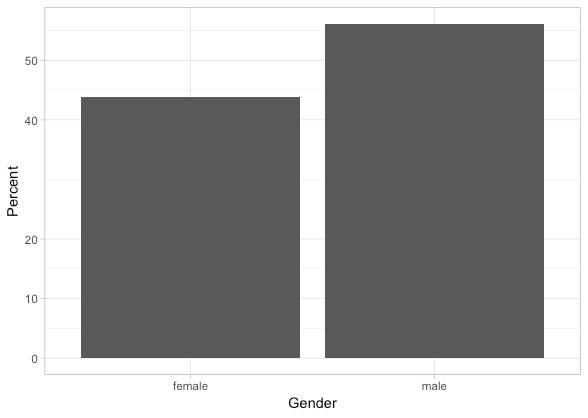 Figure 1. Percentage split between Female and Male judicial nominees under Obama. Not quite 50:50, Male = 57 %; Female = 43 % In the aggregate, Obama did a fairly good job nominating judges who were of both genders. It has been a priority since Johnson for Democratic presidents to push for diversity in their judicial appointments (Asmussen, 2011). How about the ratio between gender and whether or not the nominee was approved? 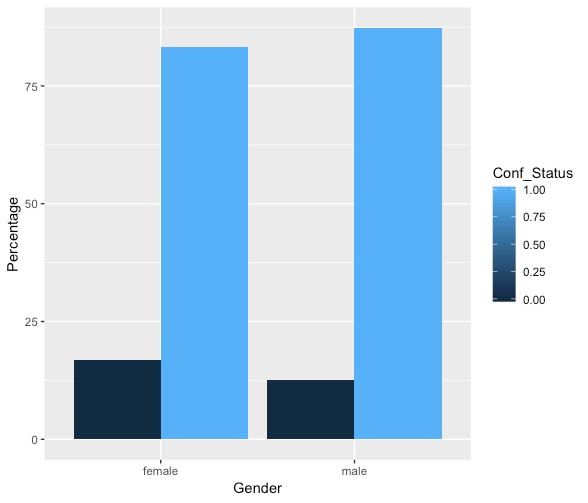 Figure 2: Percentage of judicial nominees approved by Gender. Female Approved = 83 % Female not Approved = 17% Male Approved 87% Male Not Approved 13% (I realize the color bar as a 0 - 1 scale doesn't make sense) A slightly higher proportion of female candidates were not confirmed as compared with male candidates... And recall that this plot is for all candidates over the 8 years Obama was in office, so let's examine the confirmation percentage breakdown on a yearly basis. 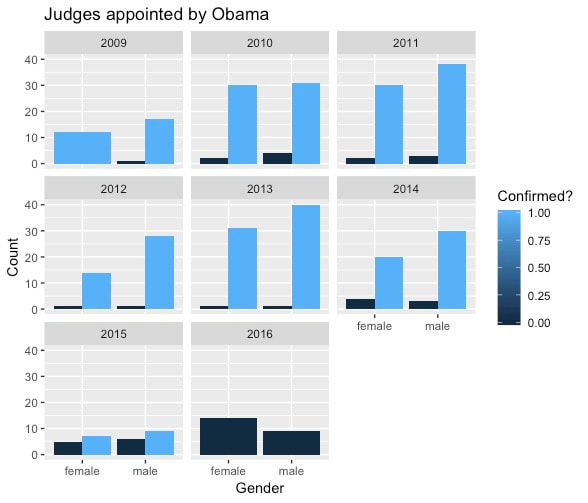 Figure 3: Gender split on confirmed and not confirmed. Remember in 2015, the Republicans took control of the Senate. 2016, the election year, saw no nominees - of either gender - confirmed. The above plot (with an error in the 2009 facet) shows that for most of the Obama years, 2009 - 2014, the likelihood of success for both female and male nominees was high. By the time the Republicans took control of the Senate in 2015, the number of nominees falls at the same time the number of nominees not confirmed rises. It's hard to test my hypothesis regarding the possible gender disparity in the nomination process under this framework, but it would appear in a subjective manner there is not a clear disparity - except that for the most part fewer female nominees were put forward over these 8 years which we know already (see Fig. 1). Instead of a histogram, let's take a look at all of the nominations over time, one way to do this is a Jitter Plot. 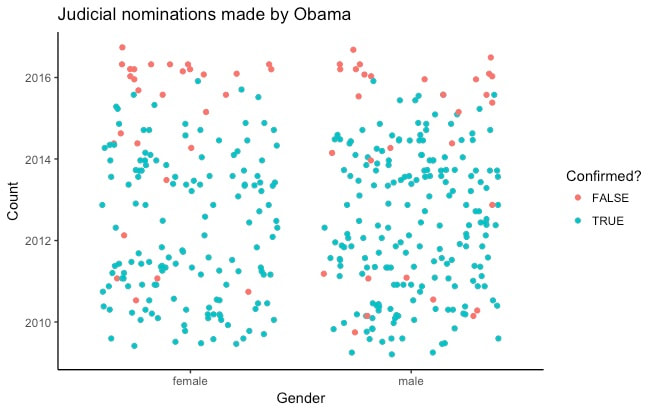 Figure 4: Jitter plot of Obama judicial nominees. Colored by their confirmation status and separated by Gender. The jitter plot reveals more subtleties hidden by the histograms in Figure 3. Pre-2015, few judicial nominees failed to be appointed, and it looks like those may have a random distribution through time - perhaps something about the nominees specifically made them less favorable to sit on the federal bench. Until, beginning in 2015 more red circles start appearing and by 2016 almost no nominees are confirmed through the Republican controlled Senate. 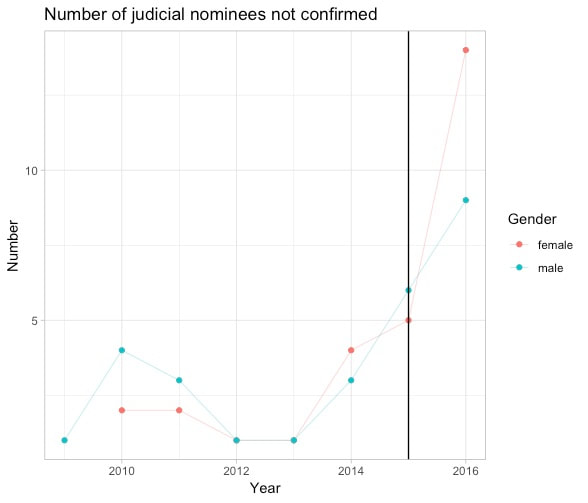 Figure 5: Number of judicial nominees not confirmed through time. But these last few plots don't really tell us anything new. I started this story by talking about how fewer judicial appointments made it through the Republican controlled upper house of the legislative branch. Perhaps another way to look at the question of gender difference in Judicial appointments is by the amount of time between nomination and successful appointment. The question being: Does the Gender of the nominee effect the amount of time before confirmation? 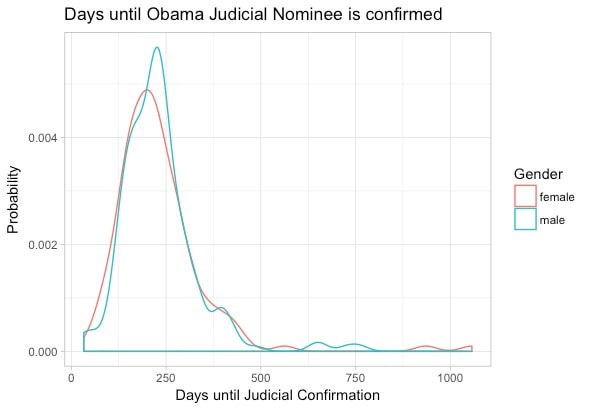 Figure 6: The PDF of Days until confirmation of all 334 successful judicial nominees during the Obama Administration Figure 6 shows the distribution of "wait time" for nominees between initial nomination and successful appointment. The median for female nominees is 212 days while for male nominees it is 223 days. That is to say, there is barely a difference between the two genders. But again, is that the case through time? 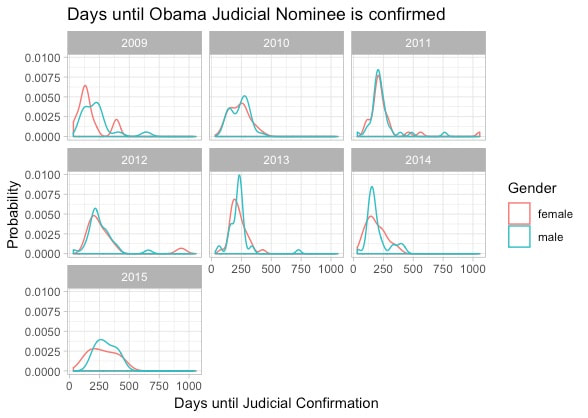 Figure 6, Days until judicial nominees appointment, by year and gender. Looking through each year of the Obama administration the overall shape of "wait time" for judicial nominees is fairly similar for each Gender. If anything the years of 2009, 2013, and 2015 look slightly more right skewed, with female nominees being approved after a shorter period than their male counterparts. However, merely examining the PDFs of "wait times" by gender doesn't give us the most quantitative look at the differences between the Gender of different nominees. For that, I'll turn to the Boxplot (see Figure 7). 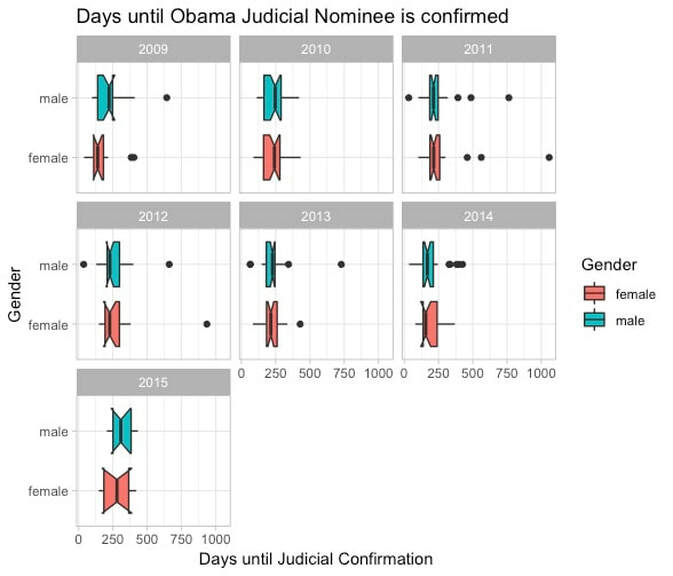 Figure 7. Boxplot of Days until Judicial confirmation by year and Gender Figure 7 is the exact same data as Fig. 6; however, I've used notched boxplots instead of PDFs. For a description of how these work, see Fig 8. The notch width corresponds to the 95% C.I. around the median. This allows for rapid hypothesis testing visually from whether or not the C.I. of two different samples are overlapping. While not exactly the same as some of the common frequentist statistical tests it allows us to at least say whether there is "strong evidence" that the medians differ (more here). The C.I. overlap for all years except 2009. This means that 2009 is the year in which we have 95% confidence that female judicial nominees had a shorter "wait time" between nomination and confirmation than did male judicial nominees. I won't hypothesize too deeply on this but perhaps the super majority in the Senate in 2009 and the fresh fervor of a diverse presidential candidate spurred action to nominate and confirm female justices quickly? Turns out The Alliance for Justice has already written about this here 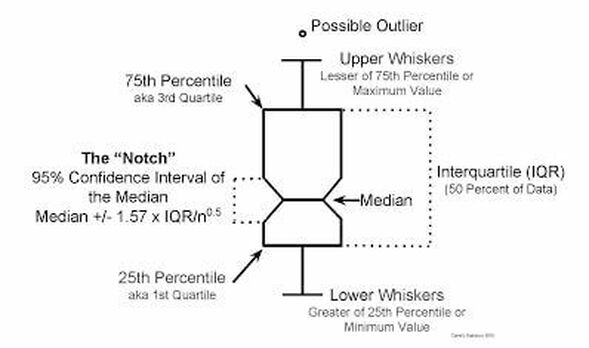 Figure 8: Notched box plot Given the results of Figure 7, I can say that the only statistically significant difference in "wait times" between genders occurred in 2009. But I still haven't really tested whether or not female judicial nominees were less likely to be appointed than their male counterparts. For this, I will need to treat successful nomination as (1) and failed nomination as (0), with an X-axis of time. This is a perfect scenario for making use of a logistic regression. 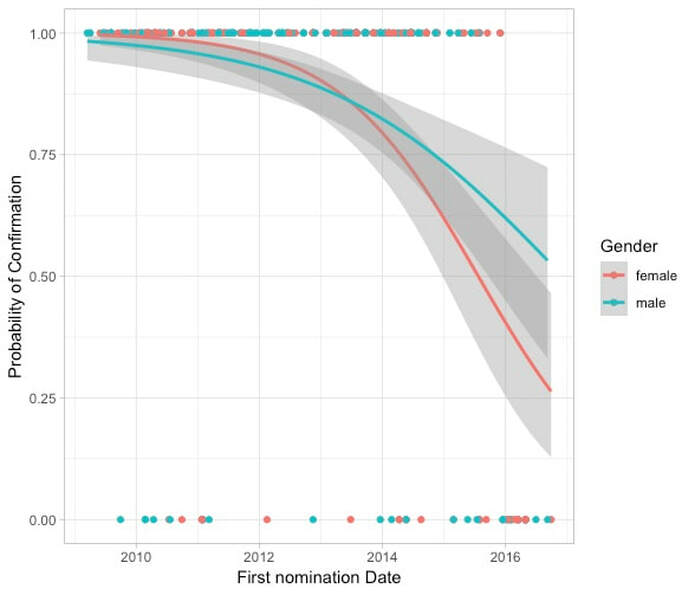 Figure 9: Logistic regression of Obama judicial Nominee success by nomination date. With Figure 9, we are finally honing in on the question of Gender based discrepancy in the approval of judicial nominees. We've already looked into whether or not for successful nominees females or males were approved of more quickly. Now, the logistic regression allows us to examine whether or not there were changes over time in the success of a nomination and evaluate any possible gender based discrepancy in this change.
Initially, (2009 - 2013) the regression indicates that female nominees (on average) had greater success in getting confirmed than male nominees. This is a reflection of the data show in Figure 5; however, the overlapping C.I. indicate that this difference is not statistically significant. The success of female nominees drops sharply after 2014, and hence the number of female nominees not successfully appointed to the judiciary also climbs (see Fig 5). Notably, this trend begins before the Republican part takes control of the Senate. Importantly, the trend of female nominees continues downward at a faster rate than the male nominees in 2015-2016. Taken at face value, or "on average" this would mean that female nominees were less successful during this time period than their male counterparts at being confirmed. Success right? We've proven! that the Republican controlled congress displayed some form of gender bias in their confirmation of Obama judicial nominees. Unfortunately, it's not entirely that straightforward. Given the significant overlap, between the C.I. on each regression it is not necessarily statistically significant that Republicans were more likely to vote to confirm male judges than female judges. Additionally, the dates on the X-axis are First nomination date. This only shows when were nominees brought forward and nominated by then President Barack Obama. This is not entirely a random process and perhaps there were more female candidates for nomination in late 2015 early 2016 and that's why this trend appears so sharp? Basic Conclusions:
0 Comments
|
