|
I started this inquiry wondering the following: Are there fewer wilderness areas being created now versus in the past. Using the data I scraped from the Wikipedia page for Wilderness areas, I built on the analysis posted in the first part of this themed blog. Just plotting a time series of wilderness area designation in the lower-48.. 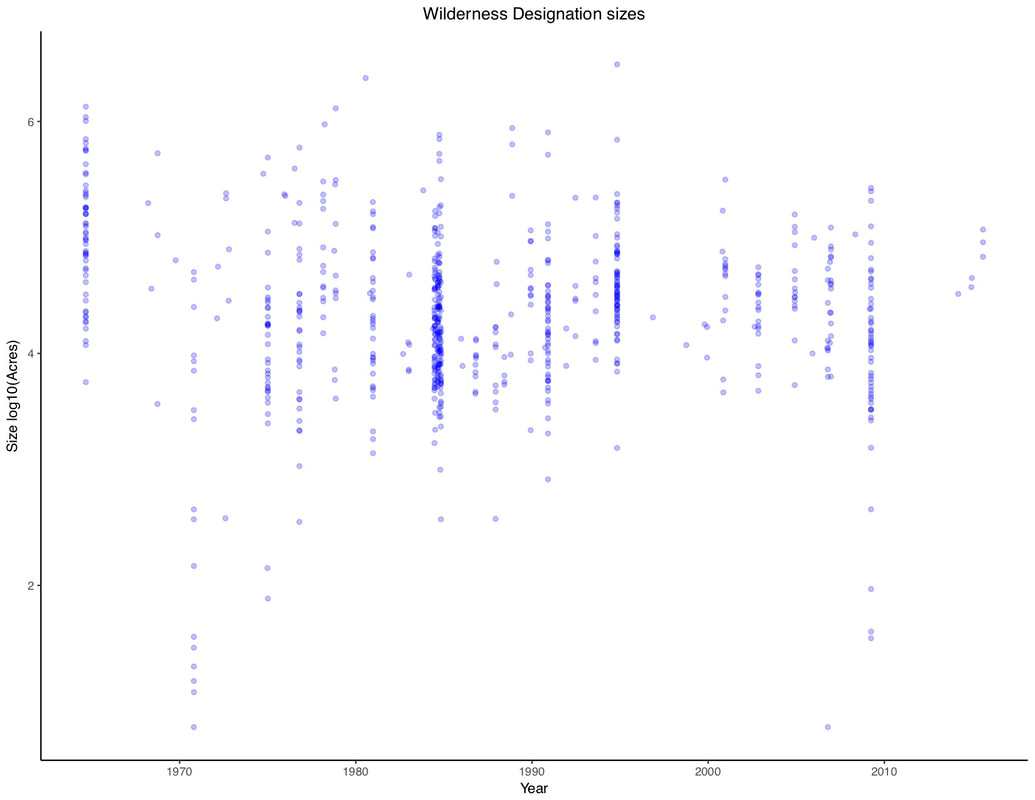 Plot of all wilderness areas created (in Lower 48) since the passage of the wilderness act. Bubbles are transparent to aid in their visualization. The Y axis is the size of each wilderness area. The above plot is interesting but not, perhaps, that informative.
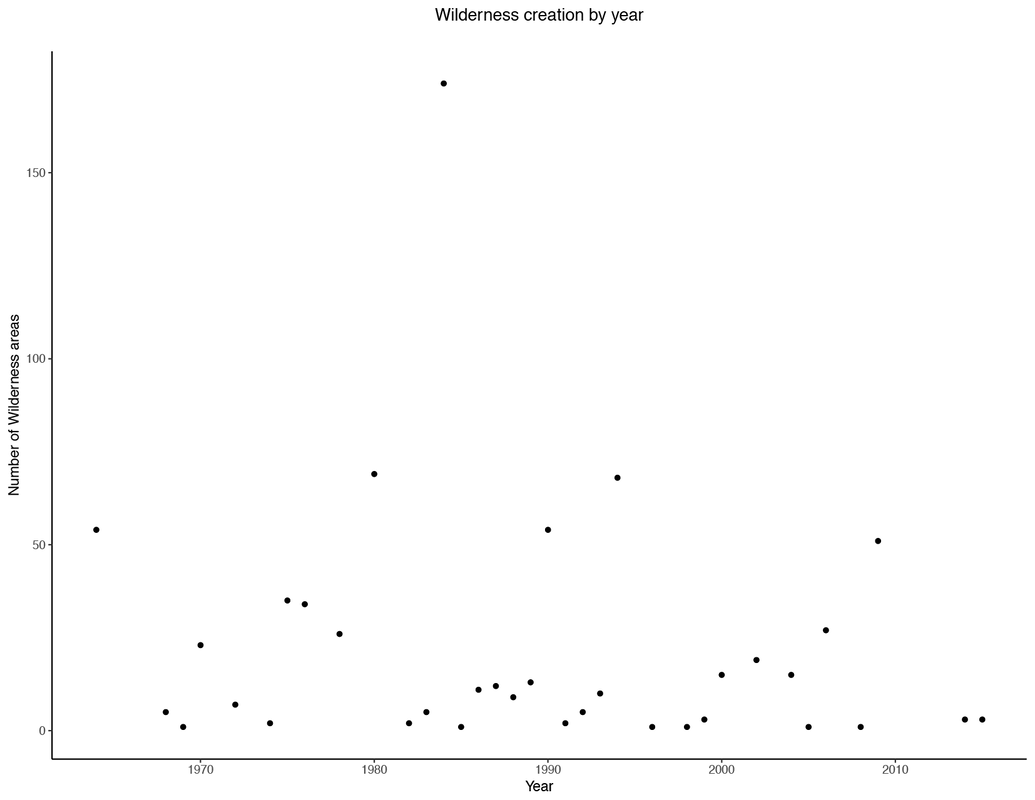 This figure is a count of the number of wilderness areas designated each year. Generally a mean is between 25 and 35. 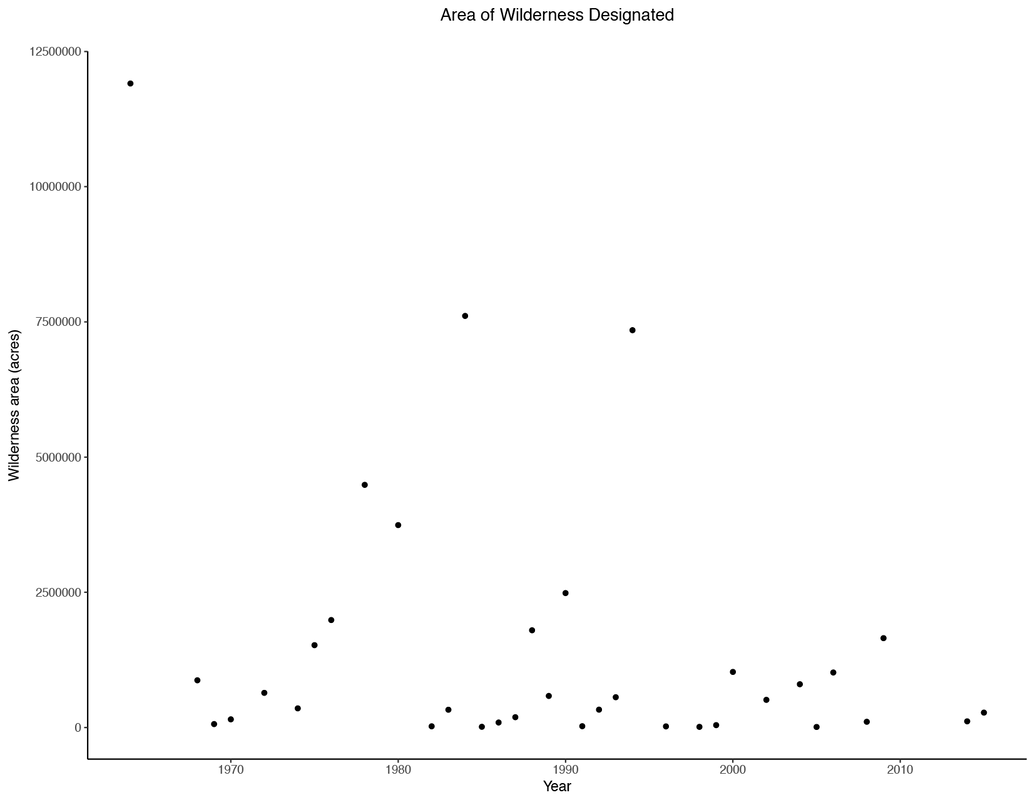 This is a plot of the overall area that is encompassed by the above wilderness areas. While generally similar in shape as the count plot, it is not exactly the same. Visual inspection alone appears to lend itself to both smaller and fewer wilderness areas. However, what our eye sees is dominated by the extremes; the mean area and number is probably fairly consistent overtime. What is the next logical step is to take a look at whether or not there is a robust indication that there are fewer or smaller wilderness areas over time. To do this, I implement a simple regression - in a deterministic sense this requires assuming a distribution a priori. Given that it's hard to have negative wilderness areas (or it was until recently), I chose the Poisson distribution. However, I'm still not sure whether this is the best assumption, given the fact that it would require that the creation of each wilderness area be independent of the previous event. For now, let's say it is. Our null hypotheses would be that 1) There is no reduction in the rate of wilderness area creation or 2) in the size of wilderness areas through time 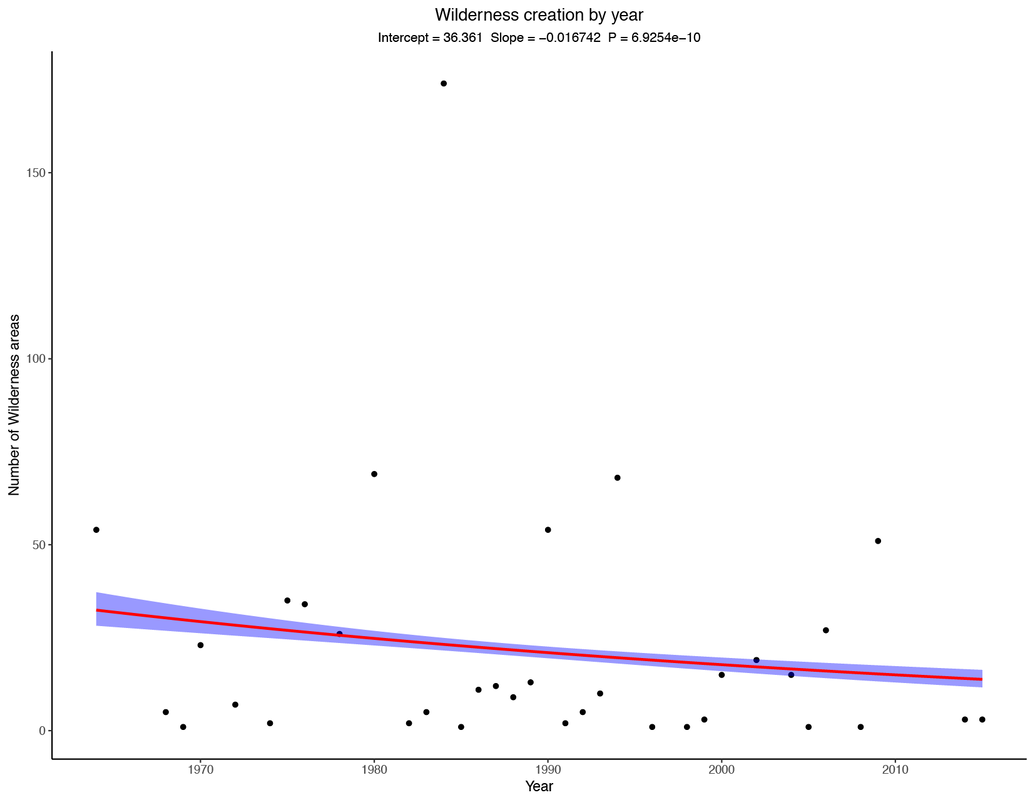 Number of wilderness areas created through time. Negative slope lends itself to that conclusion. 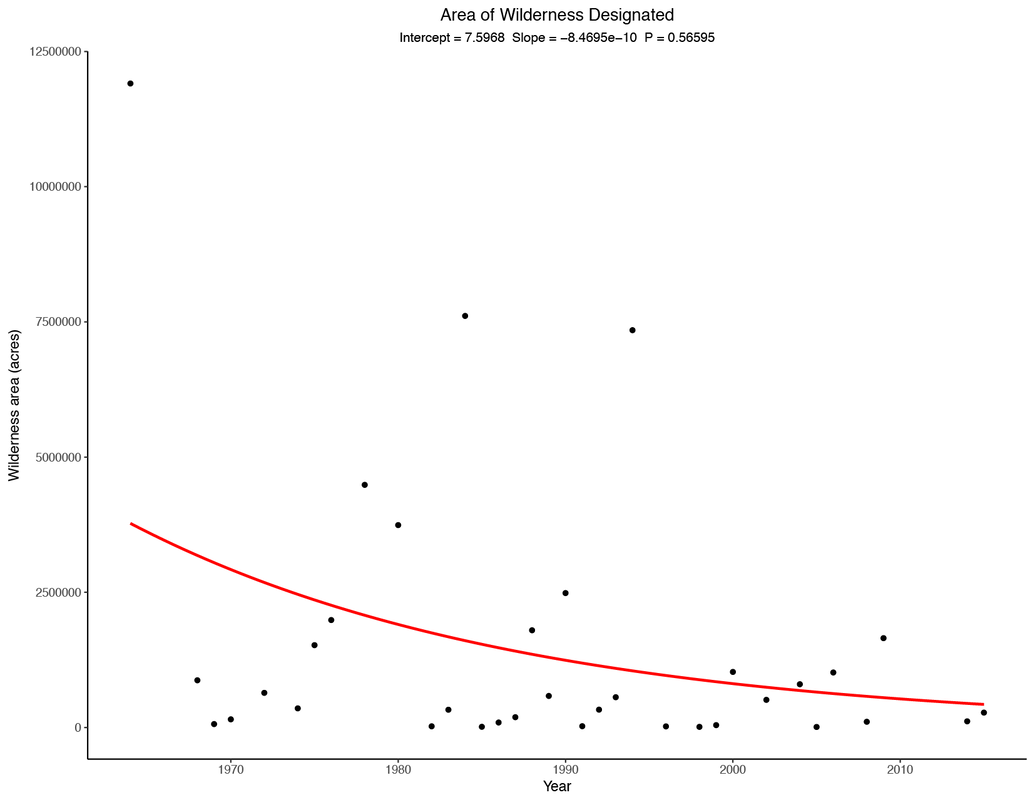 Total area/year designated as wilderness through time. These two regression lines appear to tell two different stories. Both have negative slopes, giving the impression that we may reject the Ho or null hypothesis. However, in this case, I opted for the P-value robustness test.
In the case of the count/year, there is a slightly negative slope to the curve and the P-value is exceedingly small (6.925 * 10^-10). This indicates that our confidence in the slope of the line is high (at the 95% level). Granted there is a lot of variance in the data and not that many datapoints to work with. But an initial conclusion would be that there are fewer wilderness areas being created now than in the 1970s. We can reject the null hypothesis The second regression appears at first to show that there is a similar relationship between year and the area designated as wilderness, and to some extent these variables will likely display covariance as # of wilderness areas is proportional to area. However, there is a higher p-value for this regression (p = 0.5695), indicating that I cannot reject the null hypothesis. The take away: 1) We can robustly say there are fewer wilderness areas being created 2) We cannot say that they are getting smaller.... I hope in the future to approach the problem from a Bayesian sense, if I can figure that out... Code here: https://github.com/morrismc/wilderness
0 Comments
|
