|
For the past two years, I've been running the Silver Falls Half Marathon at Silver Falls State park. I got curious for the distribution of different metrics that are available publicly from the race website. I also was looking for, at the time, a way of making myself learn how to use a new language for data visualization in Matlab: Gramm. Gramm is built on a similar framework to the ever popular ggplot2 from R. Plots below are made from the 2016 race data.  Gramm allows for simple histogram construction. 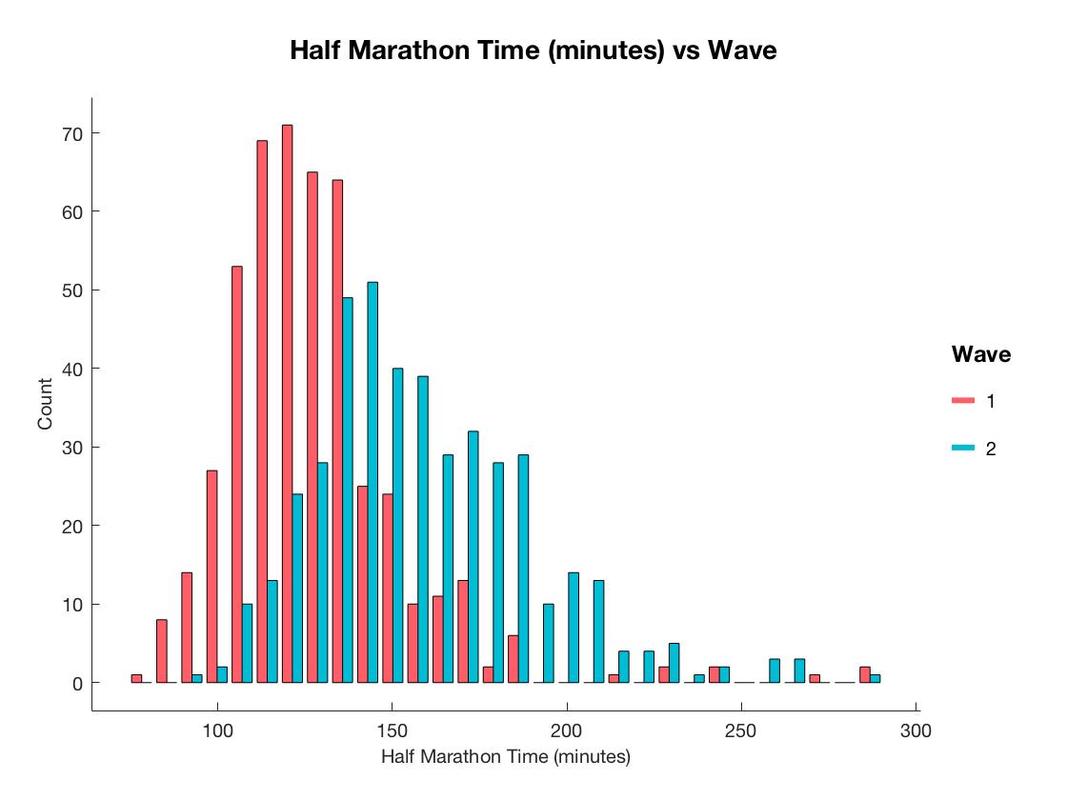 But with another simple call, approximately 20 more characters of code allow a histogram split by a variable. In this case, which wave people started with.
0 Comments
|
